Pipeline overview · Real health monitoring
How many opportunities in your pipeline can withstand review? A good number doesn't mean good quality. When you discover at month-end that many opportunities are delayed or cancelled, you often need to go back and check whether the underlying records are complete.
Check opportunity amount, stage and customer actions against consistent criteria, so the owner can review the forecast and resource allocation.
The three real illusions of Pipeline numbers
① Surface pipeline numbers look good, but month-end conversion rate is below 40%
What happened:At the end of Q2, Pipeline entry was 18 million, a very good-looking number. Actual conversion at quarter end was 7.2 million, a 40% conversion rate. Where did the remaining 10.8 million go? Customers said "budget was cut" + "project paused" + "chose someone else." This information was known by mid-Q2, but the Pipeline numbers weren't updated in time.
Root cause:Pipeline numbers are "entered values" rather than "real values," with no dynamic health assessment mechanism. False numbers lead to wrong resource allocation decisions.
② Quarterly forecasts are always off by more than 50%
What happened:Every quarter when forecasting, managers and sales reps discuss and report numbers together, and at month's end the actual results are far off. The sales director asks "why is the forecast deviation so large," and the manager can't answer, because the numbers were just guessed at the time.
Root cause:Forecasts are not based on the real quality and cadence data of opportunities, but on "wishes" and analogies to "the same period in history."
③ Not knowing which opportunities are dragging down overall win rate
What happened:There are 50 opportunities in the team pipeline, but the win rate never improves. The manager knows the win rate is a problem but not where the root cause lies — is it a sales capability issue? An opportunity quality issue? Or a resource allocation issue?
Root cause:The pipeline has no quality-tiered analysis tool, so you only see the total volume, not the structural problems.
AI-driven Pipeline Health System
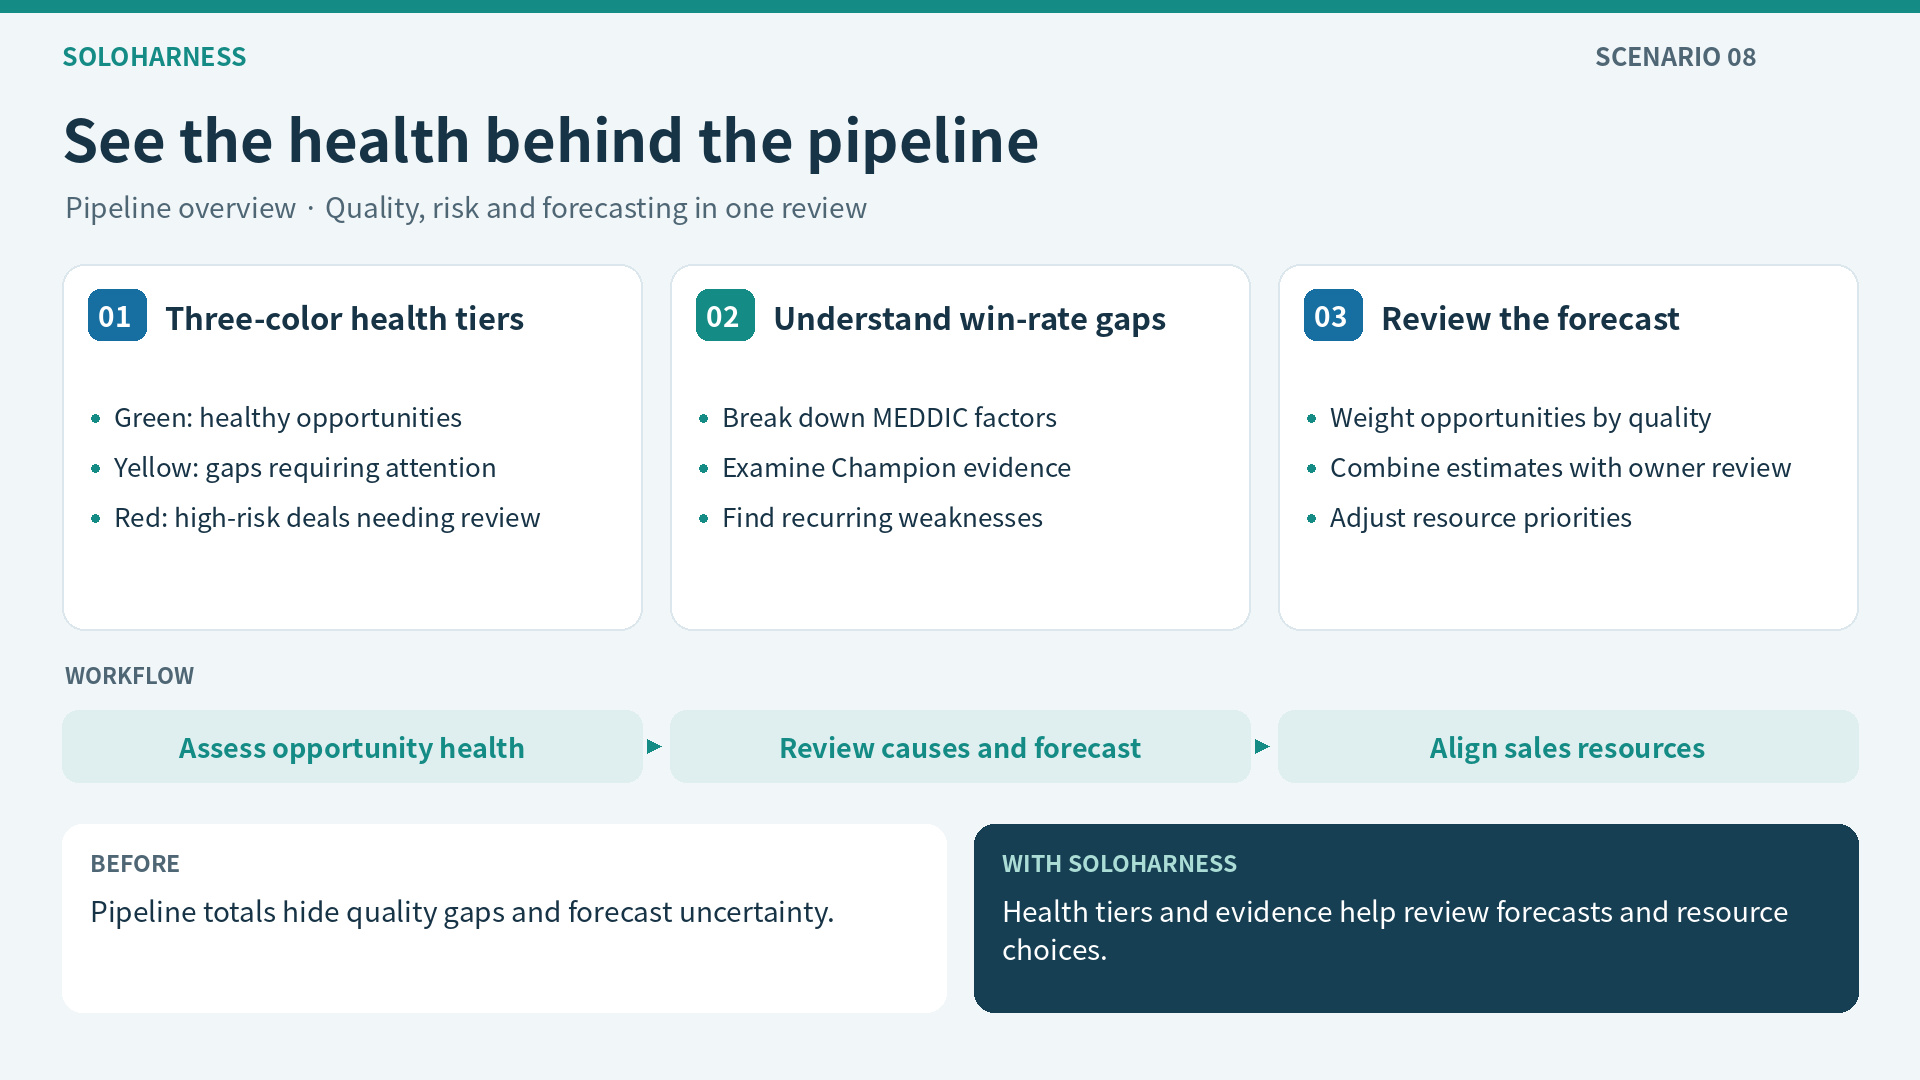
Three-color tiering of pipeline health
The system can tier the pipeline by amount, stage, and risk for owners to review together:
MEDDIC score ≥ 40, pace is normal, Champion confirmed
MEDDIC score 25-39, with 1-2 key gaps
MEDDIC score < 25, suspected false progress, requires immediate Review
📊 Pipeline real value vs. surface value
Surface amount
¥13.5M
AI health weighting
¥7.8 million
Win rate root cause analysis — why the overall win rate won't go up
🔍 Q2 Win Rate Root Cause Analysis | Sales Team
Problem 1: Missing Champion is the biggest loss factor
• Compare opportunity performance with and without Champion advancement evidence
• Check whether differences come from opportunity quality, stage or resource investment
→ Champion development should become a core sales metric
Problem 2: EB outreach timing is too late
• Compare opportunity performance of early versus late EB outreach
• Review outreach timing together with other Gate evidence
→ "Timing of first EB contact" should be tracked as a key sales action
Dynamic forecasting — less guesswork
📈 Q3 Quarterly Forecast | Dynamically Updated
This forecast is weighted by opportunity quality tiers; actual deviation still depends on data completeness and the owner's judgment
Scenario 8 core comparison
| Metrics | Before | After |
|---|---|---|
| Pipeline quality | Looking only at amount, not quality | Three-color tiering, transparent health |
| Forecast method | Guesswork, with big deviations discovered at month-end | Weighted by quality, combined with owner review |
| Win rate analysis | Don't know where the root cause is | MEDDIC factor breakdown to help find the cause |
| Resource allocation | By experience, high-risk and healthy opportunities are treated the same | AI recommends differentiated resource investment strategies |
How large is your quarterly forecast deviation?
If it exceeds 30%, the underlying pipeline data quality is the problem, not the forecasting model.